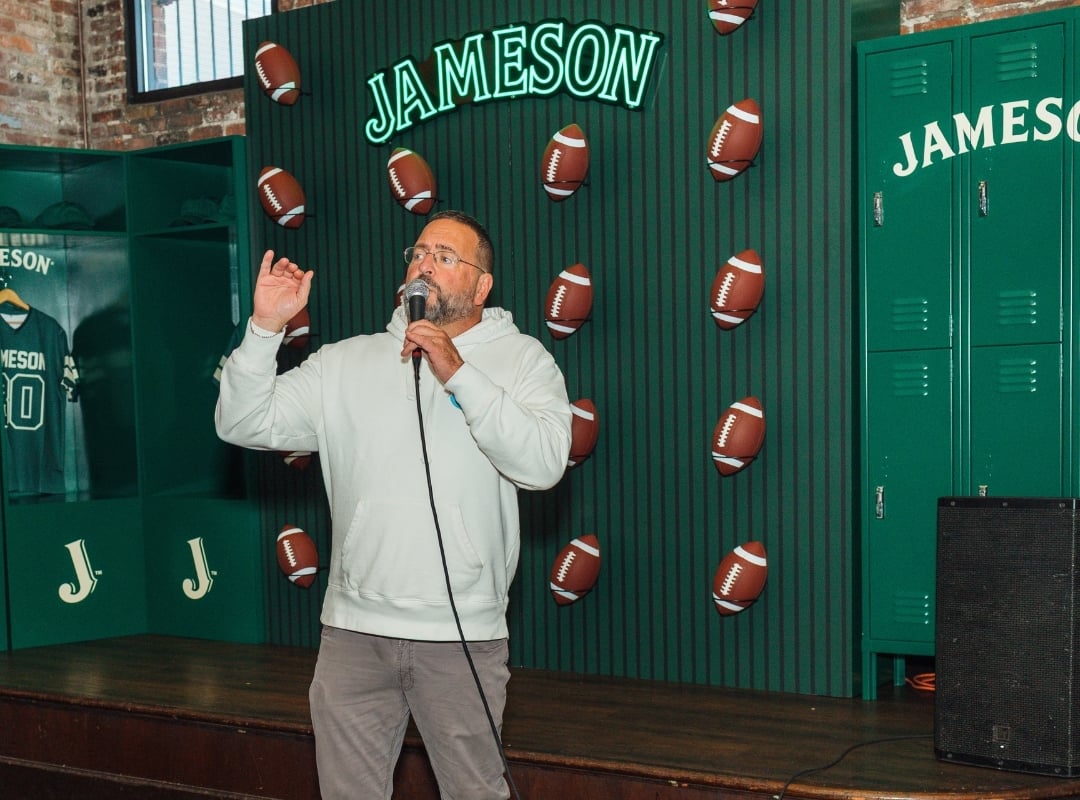
Sponsoring a stadium activation is one thing. Proving it drove measurable brand engagement is another. Marketing directors at sports and entertainment venues face growing pressure from sponsors who want proof that their investment created real fan interaction, not just another logo on a concourse wall.
This guide gives you a complete measurement framework for experiential marketing campaigns inside large sports venues. You'll learn which metrics matter at each stage, how to capture them without disrupting the fan experience, and how to report results that justify continued investment. Whether you manage activations at a 20,000-seat arena or a 70,000-seat NFL stadium, the principles and tools here apply.
Key Takeaways: Measuring Brand Engagement in Stadium Activations
- Effective stadium activation measurement combines on-site behavioral data with post-event digital follow-through metrics.
- Dwell time, interaction depth, and first-party data capture are more valuable than raw foot traffic counts.
- Pre-event benchmarking gives you a baseline to compare activation performance against normal venue activity.
- BluEdge helps venue marketing teams execute measurable stadium activations with end-to-end production and installation.
- Social amplification metrics extend measurement beyond the venue walls and into earned media value.
Why Traditional Sponsorship Metrics Fall Short at Venue Activations
For decades, sports sponsorship measurement relied on estimated impressions, broadcast camera time, and logo visibility scores. Those metrics tell you how many people may have seen a sponsor's name. They do not tell you how many people stopped, interacted, or remembered the brand after leaving the venue.
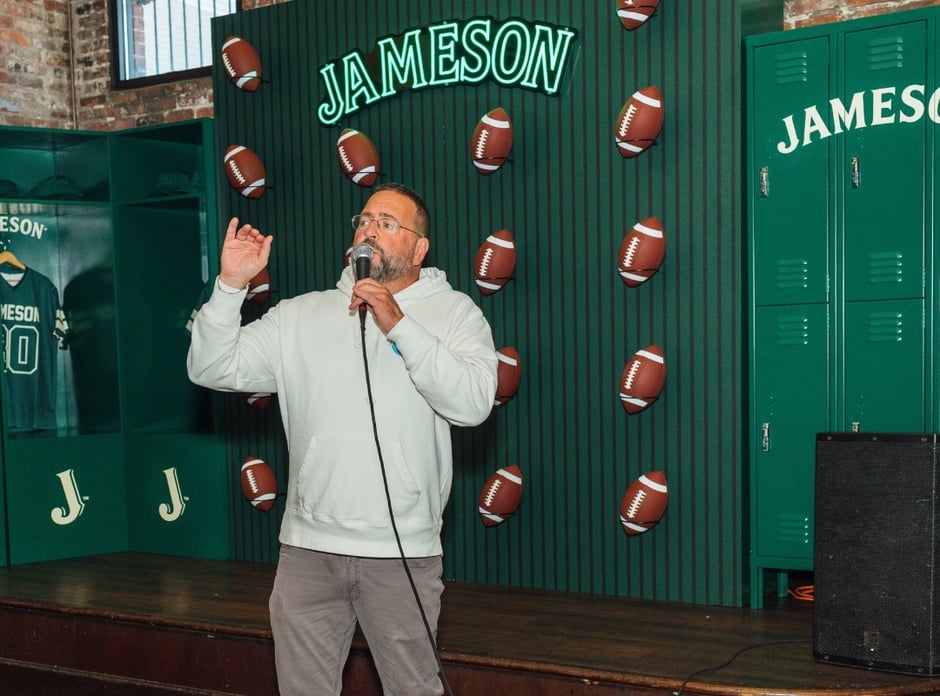
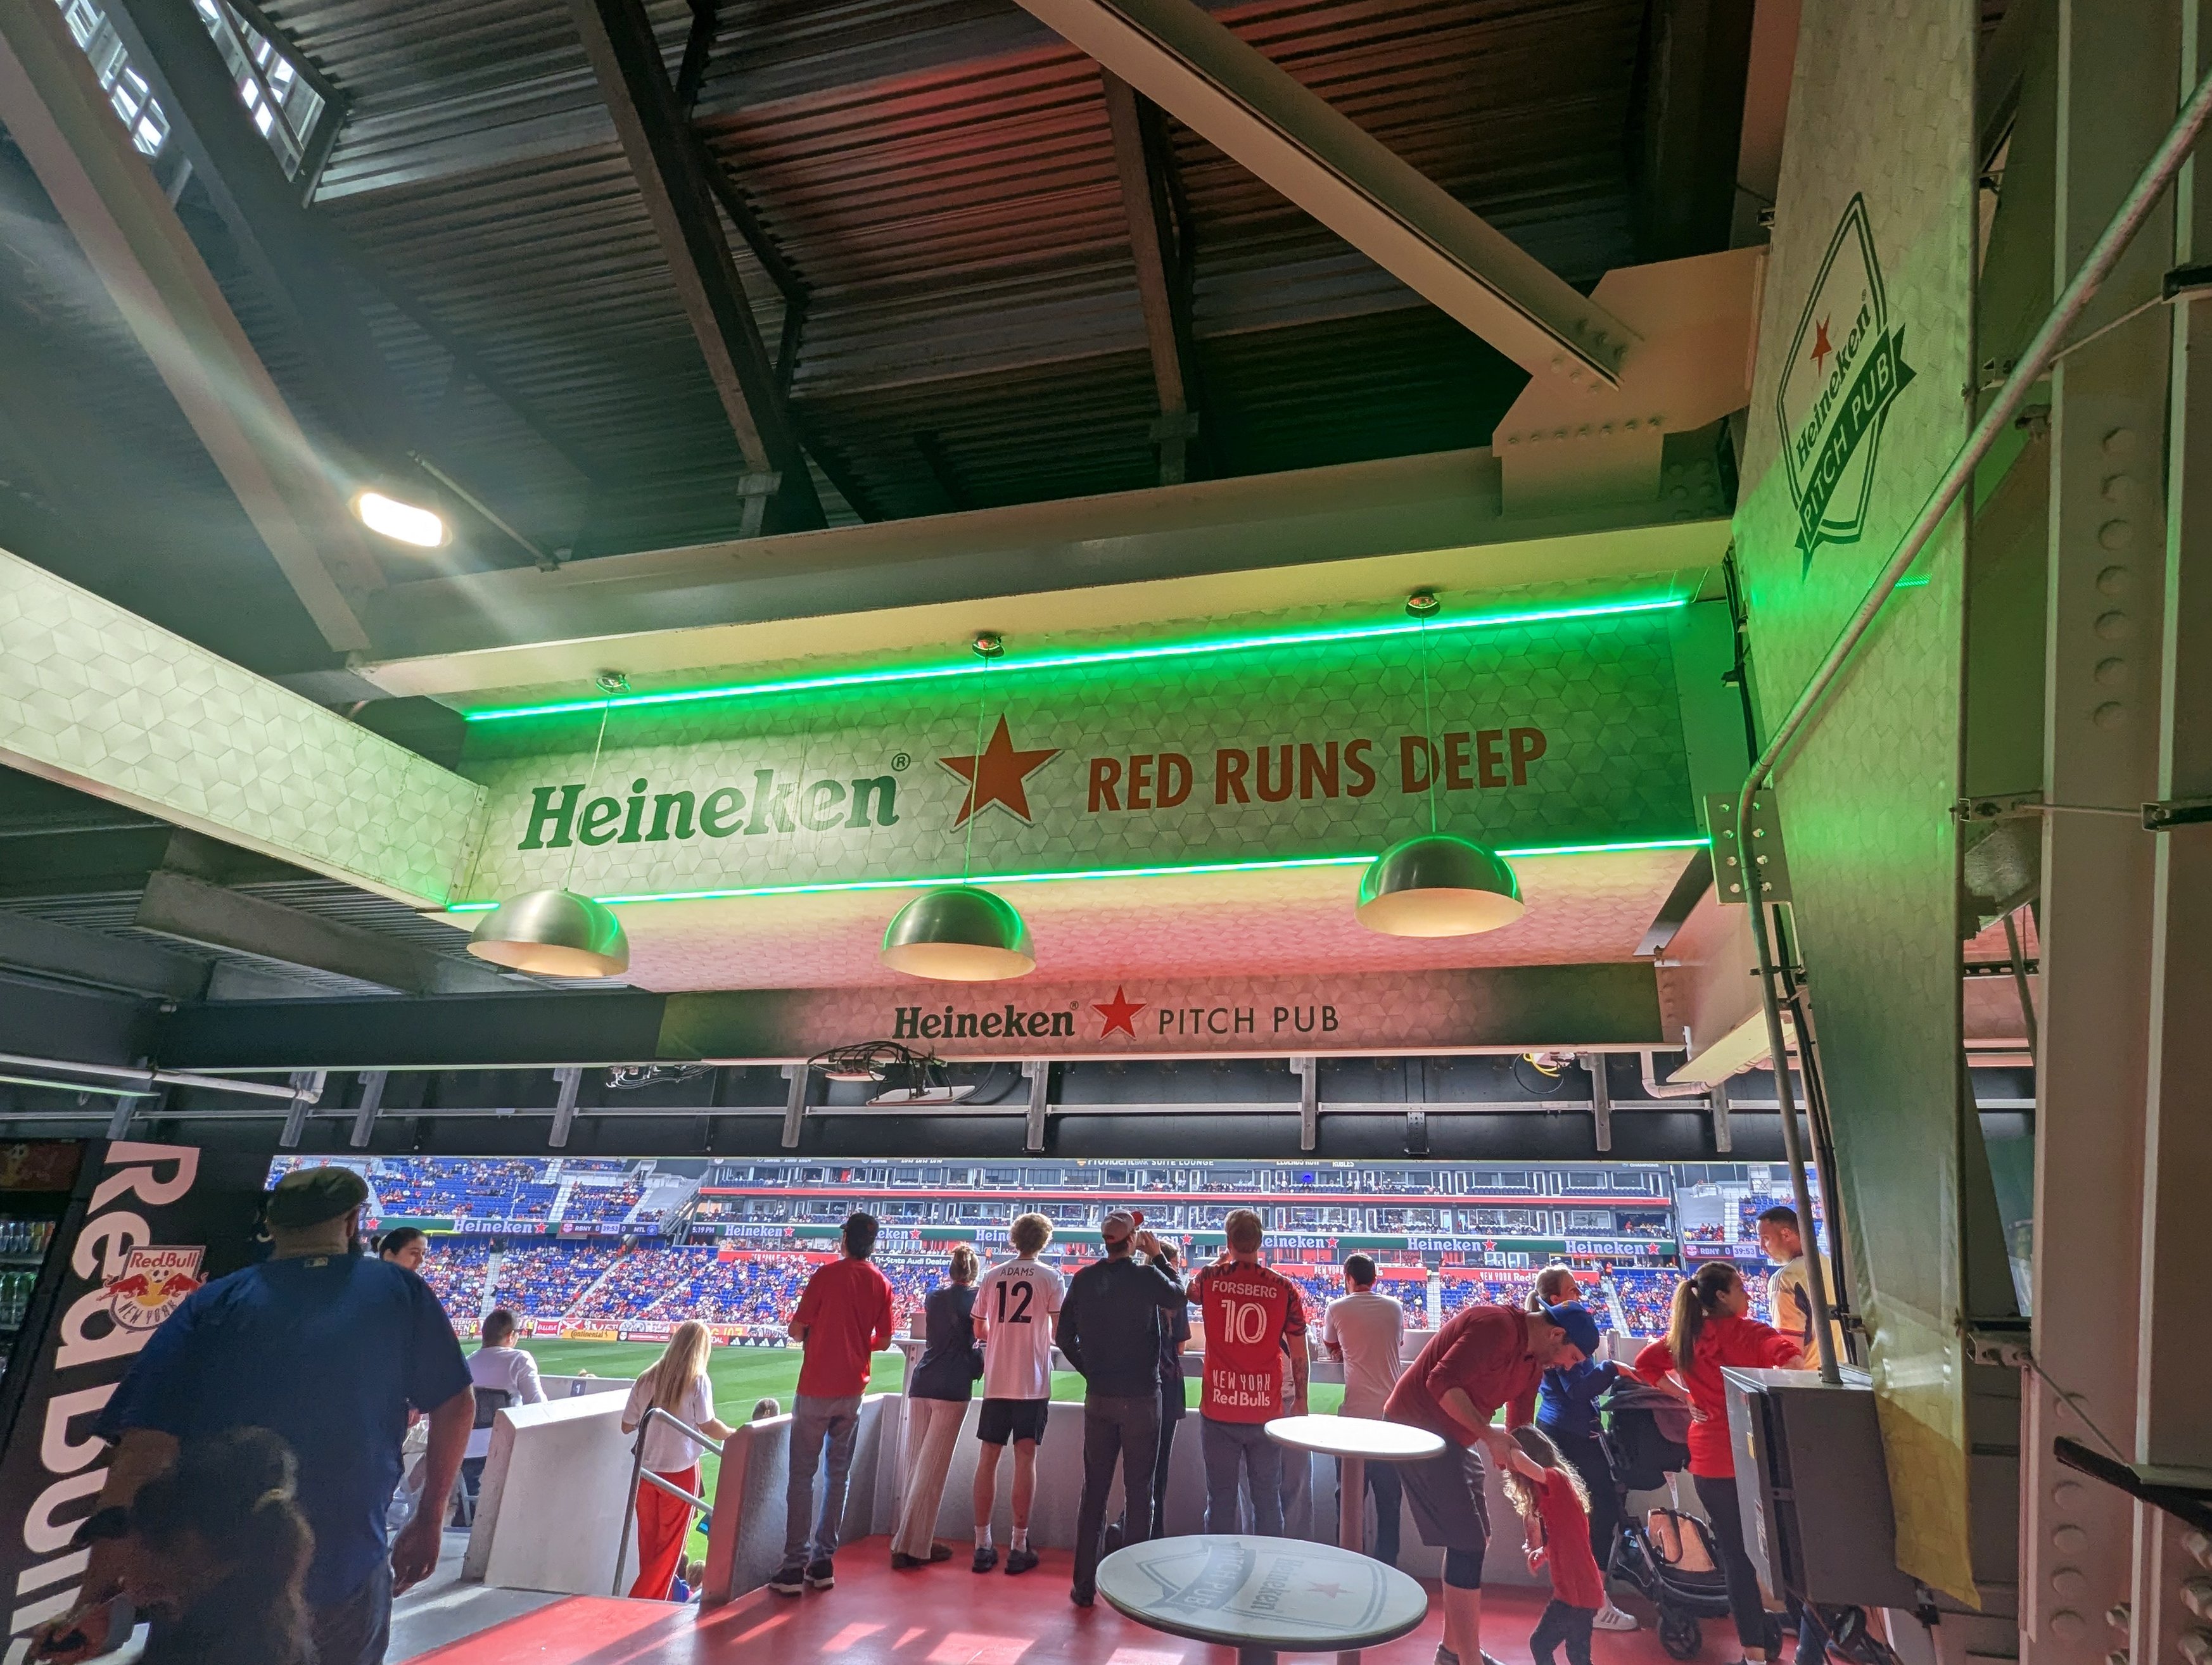
Stadium activations are experiential by nature. A branded fan zone, an interactive game, or a product sampling station generates value through participation, not passive exposure. Measuring participation requires a different set of tools than measuring eyeballs on a banner.
According to the EventTrack 2026 study by Event Marketer and Sparks, 61% of consumers say they are more inclined to purchase after attending a live brand experience. That statistic only becomes meaningful for your venue when you can connect it to specific activation touchpoints and measure the journey from interaction to action.
What Are the Core Metrics for Stadium Activation Engagement?
Stadium activation engagement breaks into three measurement layers: physical presence, active participation, and post-event follow-through. Each layer captures a different dimension of how fans interact with a branded experience inside your venue.
Physical Presence Metrics
Physical presence metrics answer the question: how many fans encountered your activation? This layer includes foot traffic counts at the activation footprint, unique visitor estimates using anonymized sensor data, and the ratio of passersby to those who paused for at least three seconds.
Venue operations teams often already collect pedestrian flow data for crowd management purposes. Aligning your activation measurement with existing signage and wayfinding infrastructure can reduce setup costs while improving data accuracy.
Active Participation Metrics
Active participation metrics answer the question: how deeply did fans engage? This is the layer that separates a successful activation from a well-placed billboard. Key indicators include dwell time at the activation footprint, interaction count per visitor, completion rates for games or challenges, product samples distributed, and QR code or NFC scans initiated by the fan.
Exposure Analytics' Physical Engagement Index 2026, built from sensor data across more than 3,000 events and 43.8 million visitors, found that the top 10% of branded activations converted 76.3% of visitors into active engagement while the bottom 10% converted just 3.9%. That gap reinforces why measuring depth of engagement matters far more than counting heads.
Post-Event Follow-Through Metrics
Post-event metrics answer the question: did engagement translate into lasting brand connection? Track email opt-in rates from activation sign-ups, redemption rates on offers distributed during the activation, social media mentions using a campaign-specific hashtag, and website or landing page visits within 48 hours of the event.
These metrics connect the physical experience to the digital ecosystem and give sponsors evidence that the activation created a pipeline, not just a moment.
How Do You Build a Measurement Framework Before Game Day?
Measurement that starts on game day is already too late. The most useful data comes from a framework designed before the activation is even built, with clear objectives, baseline benchmarks, and data capture tools integrated into the activation itself.
Step 1: Define What Success Looks Like
Start by aligning with the sponsoring brand on specific, measurable objectives. Are you trying to maximize fan interactions, capture first-party data for future marketing, generate social content, or demonstrate purchase intent? Each objective points to a different set of priority metrics.
A well-defined objective also prevents the common trap of measuring everything and concluding nothing. When your sponsor meeting ends with a clear statement like "we want 5,000 unique interactions with 15% email opt-in," the measurement plan writes itself.
Step 2: Establish Baseline Benchmarks
Before your activation goes live, collect baseline data on normal fan behavior in the same venue zone. How much foot traffic does that concourse section receive on a typical game day? What is the average dwell time at nearby concession or retail areas? Baseline data transforms your post-activation numbers from isolated figures into meaningful comparisons.
Request pedestrian heat maps from your venue operations team. If your venue doesn't collect this data, consider a low-cost observational study during one or two events before your activation date.
Step 3: Integrate Data Capture Into the Activation Design
Data capture should be part of the activation experience, not something tacked on as an afterthought. QR codes, NFC-enabled wristbands, SMS opt-ins, and gated digital interactions all provide first-party data when built into the participation flow.
The goal is to make data capture feel like part of the fun. A leaderboard that requires a quick sign-up, or a photo experience that sends images via text, captures contact information while adding to the fan experience rather than interrupting it.
Which Technologies Help You Capture Engagement Data at Scale?
Venue-scale activations require measurement technology that can handle tens of thousands of fans moving through compressed time windows. The right tools depend on your budget, your venue's infrastructure, and how granular your reporting needs to be.
Sensor-Based Foot Traffic and Dwell Time Tracking
Wi-Fi and Bluetooth beacon sensors placed around an activation footprint can estimate unique visitors and dwell time by detecting mobile device signals. These tools work passively, requiring no action from the fan, and produce reliable aggregate data at scale.
Keep in mind that a sold-out stadium puts tens of thousands of mobile devices on the same cellular towers. Any technology relying on the venue's public Wi-Fi will underperform. Budget for a dedicated private network covering your activation zone, as venue infrastructure planning is critical to reliable measurement.
Interactive Technology With Built-In Analytics
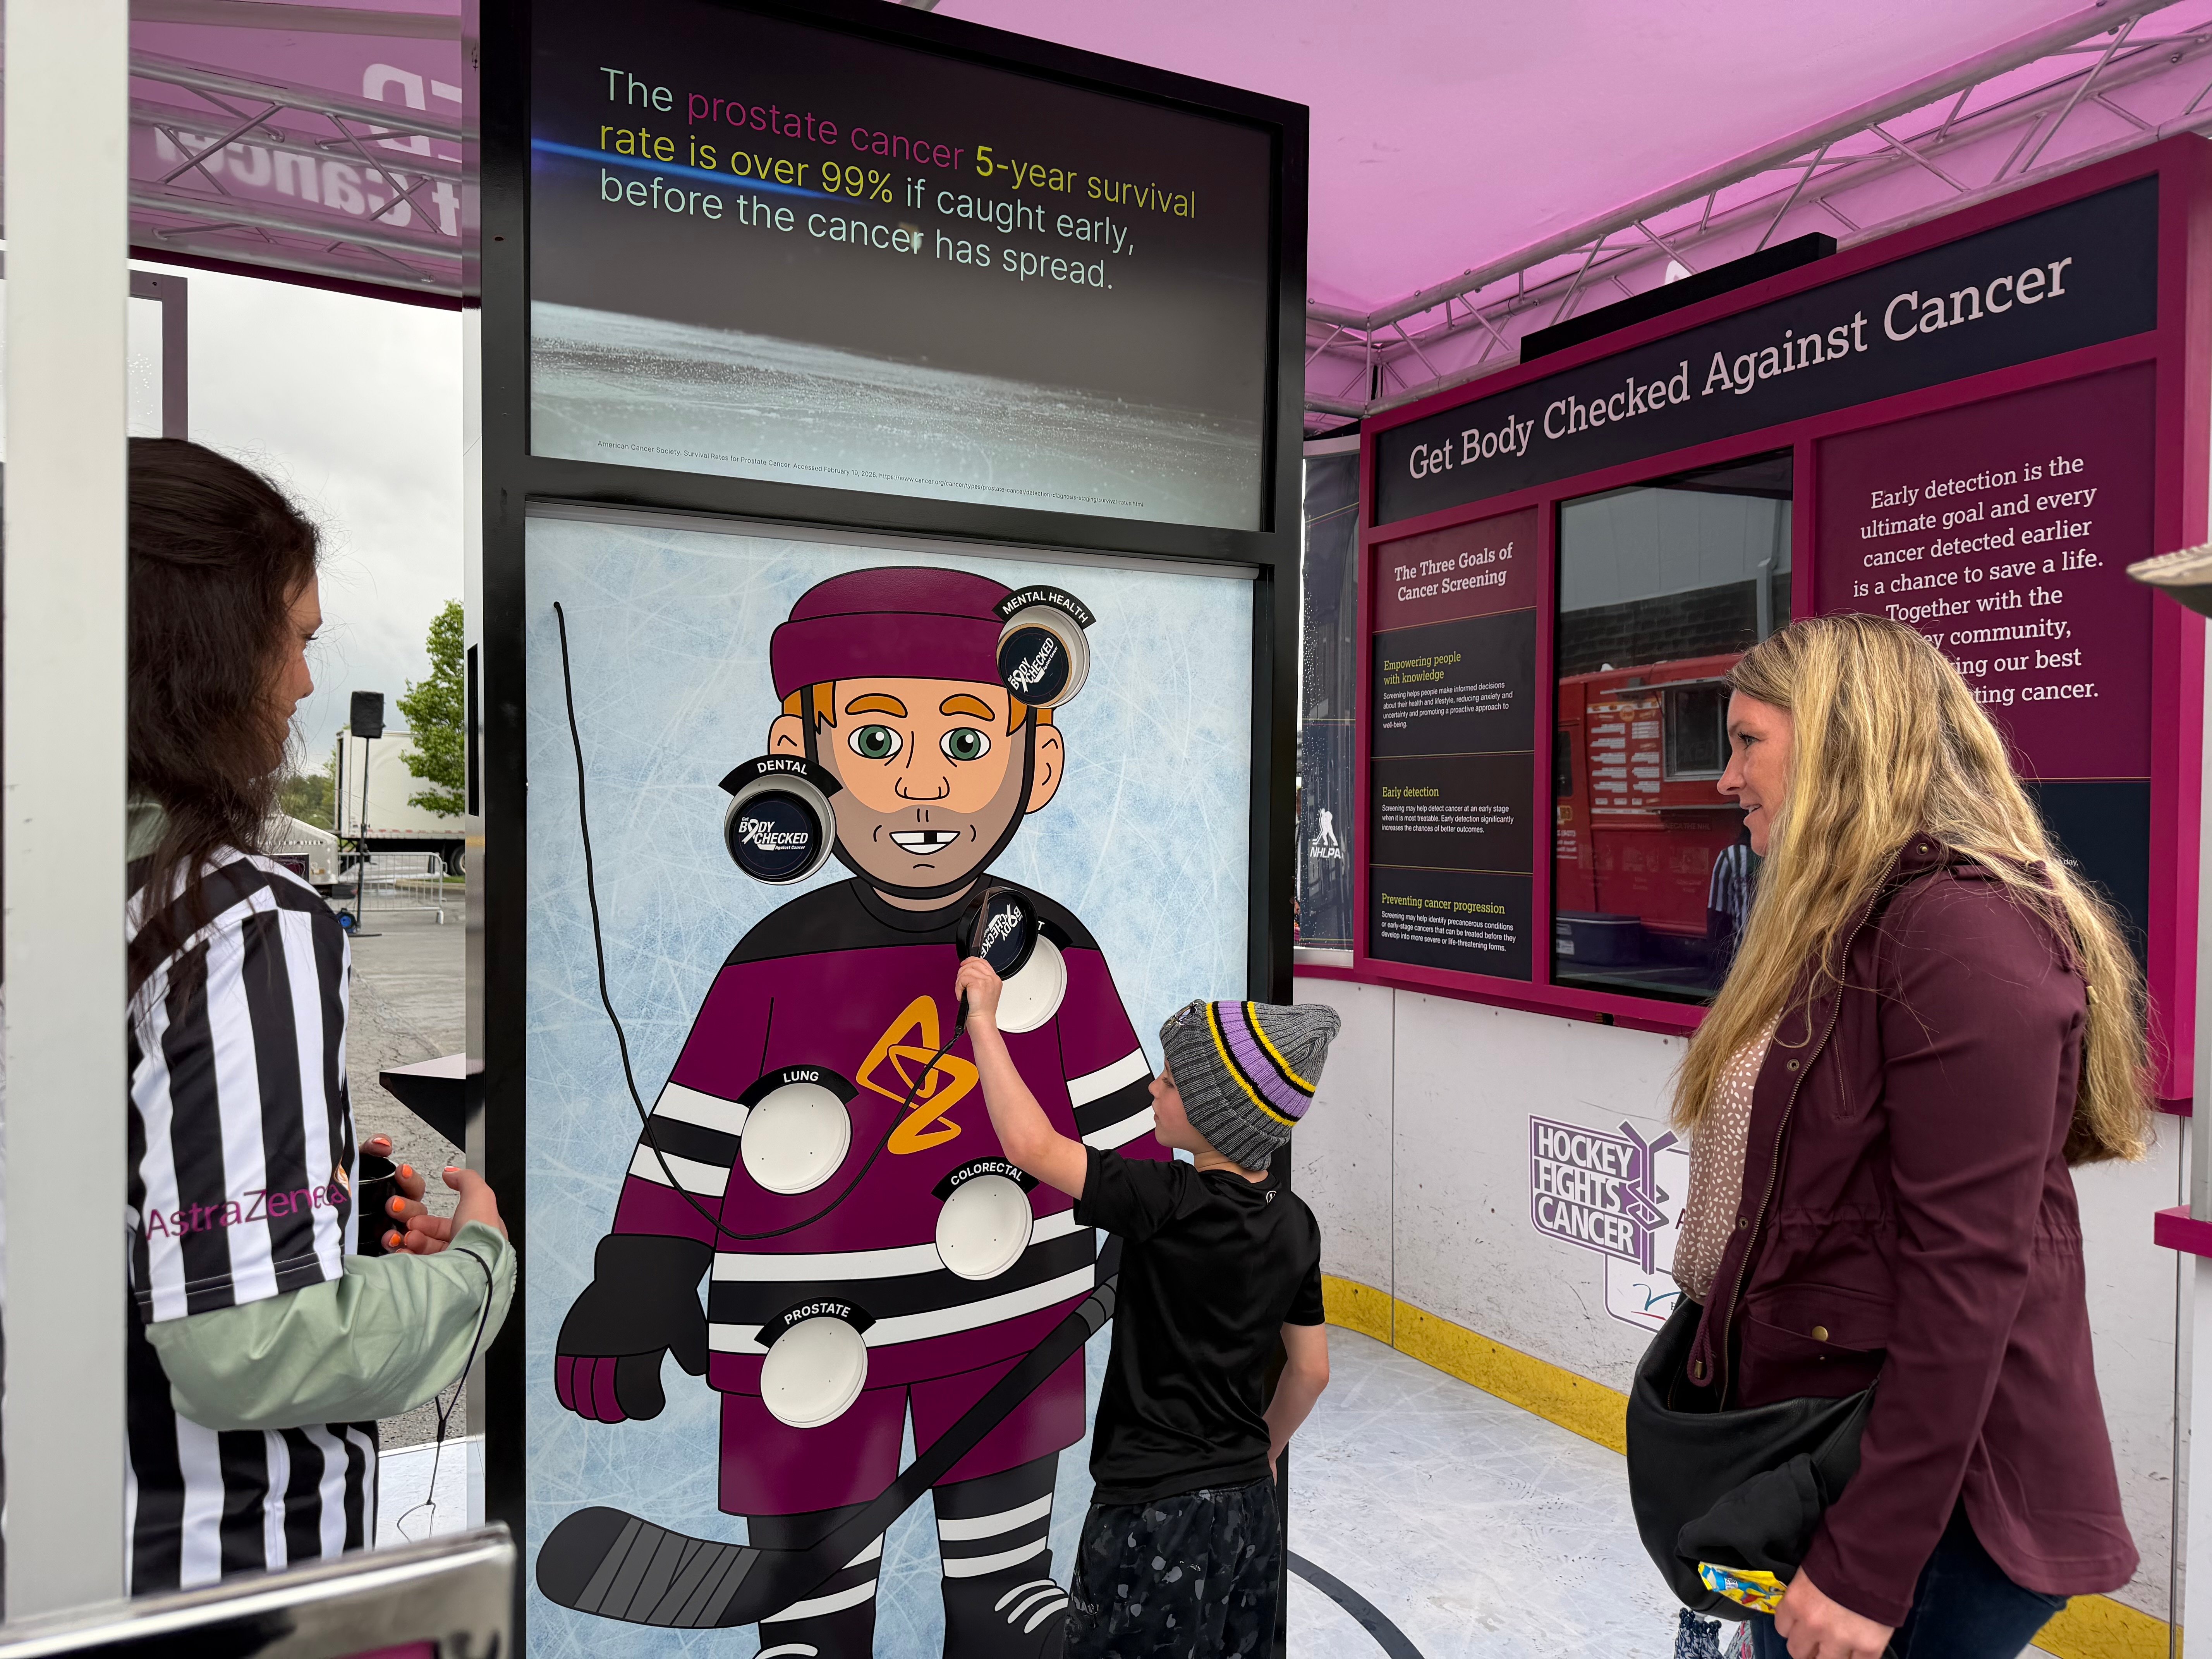
Touchscreens, AR experiences, gamified challenges, and projection mapping installations can log every interaction automatically. These tools capture interaction count, time spent, completion rates, and user paths through multi-step experiences.
When BluEdge produces custom fabrication and digital content for stadium activations, the production team can engineer analytics-ready installations from the design phase. Building measurement into the physical structure eliminates the need for third-party overlays that often introduce technical failure points.
First-Party Data Capture Tools
QR codes remain one of the most reliable and cost-effective tools for first-party data collection at venue activations. NFC-enabled tap points, SMS short codes, and gated Wi-Fi sign-ins offer alternatives for fans who prefer different interaction methods.
Every data capture mechanism must comply with privacy regulations. Clear consent language, transparent data use policies, and easy opt-out options are required. Building trust with fans on data practices protects both the venue and the sponsor from regulatory and reputational risk.
How Do You Measure Social Amplification From a Stadium Activation?
Social media activity generated by a stadium activation extends the brand's reach far beyond the physical venue. Measuring that amplification accurately requires tracking both earned and prompted social engagement.
Tracking Branded Hashtag Usage and User-Generated Content
Create a campaign-specific hashtag for each activation and monitor volume, reach, and engagement rates across platforms. Track the number of unique creators posting content with the hashtag, the total impressions those posts generate, and the sentiment of the content being shared.
Photo-worthy activation design drives organic social sharing. Elements like large format graphics, dimensional structures, and immersive environments give fans something visually compelling enough to photograph and share without prompting.
Calculating Earned Media Value
Earned media value assigns a dollar figure to the organic reach your activation generates. While the calculation methods vary across the industry, a common approach multiplies total earned impressions by an agreed-upon CPM rate. This gives sponsors a financial frame of reference for the social visibility the activation produced.
Be transparent about the methodology you use. Sponsors appreciate honest reporting over inflated numbers, and a consistent calculation method across multiple game days makes trend data reliable.
What Role Does Activation Design Play in Measurable Engagement?
Your activation's physical design directly determines whether fans engage at all. A poorly placed or visually unremarkable installation will not generate the data you need, regardless of how sophisticated your measurement tools are.
Fan-Flow Positioning
Activation placement within the venue is the single most influential factor in driving foot traffic. High-traffic zones like main concourse entries, concession corridors, and restroom adjacencies consistently outperform peripheral locations.
Request pedestrian heat maps from your venue operations team and negotiate placement in one of the top three traffic zones. BluEdge's arena and stadium branding team works with venue operations to position installations where fan traffic naturally concentrates.
Multi-Sensory and Interactive Elements
Activations that engage multiple senses hold attention longer and generate deeper interactions. Sound, movement, tactile elements, and visual spectacle all increase dwell time, which is one of your most important engagement indicators.
Interactive elements like skill challenges, trivia games, or product customization stations create natural stopping points that produce measurable interactions. Each touchpoint becomes a data collection opportunity when built into the activation architecture.
Material and Environmental Durability
Outdoor stadium activations face wind, rain, temperature extremes, and direct sunlight. Materials that degrade during the event undermine both the fan experience and your measurement window. UV-resistant inks, wind-rated structures, and weather-sealed electronics enclosures are baseline requirements for outdoor venue activations.
BluEdge produces stadium graphics engineered for active venue environments, ensuring that your activation stays operational and measurable through the full event window.
How Do You Report Activation Results to Sponsors?
Your measurement framework is only as valuable as the report it produces. Sponsors need clear, honest, and actionable reporting that connects activation performance to their business objectives.
Structure Your Report Around the Three Measurement Layers
Organize your report into physical presence, active participation, and post-event follow-through sections. This structure mirrors the fan journey and makes it easy for sponsors to see where engagement was strong and where there is room for improvement.
Include a comparison to your baseline benchmarks so sponsors can see the activation's incremental impact versus normal venue activity in the same zone.
Use Visual Data Presentations
Heat maps, interaction timelines, and comparison charts communicate results more effectively than spreadsheet tables. A visual showing peak engagement during the pre-game window, for example, tells a sponsor exactly when their activation was performing and why.
Trend data across multiple game days is especially valuable. It shows sponsors which creative approaches, time windows, and placement strategies produced the strongest results over a season.
Connect Metrics to Business Outcomes
The final section of your report should translate activation metrics into business language. Convert email opt-ins into pipeline value. Translate social impressions into earned media equivalency. Map offer redemptions to attributable revenue.
Sponsors invest in stadium activations to drive business results. Your report should make the connection between fan engagement inside the venue and commercial impact outside of it.
How Can You Improve Activation Measurement Over Multiple Seasons?
Stadium activation measurement gets more valuable over time. Comparative data from multiple events at the same venue reveals patterns that single-event measurements cannot show.
Build a Season-Long Dataset
Track the same core metrics across every activation during a season. Consistent measurement across four to eight game days produces trend data that reveals which locations, time windows, and activation formats drive the strongest engagement.
A venue marketing director who can show sponsors "interaction rates increased 22% from the first event to the fifth" demonstrates continuous optimization that justifies multi-year partnerships.
A/B Test Activation Variables
Use different game days to test specific variables while holding other factors constant. Test placement in Zone A versus Zone B during weeks with similar attendance projections. Test a gamified interaction against a product sampling approach during events with comparable demographics.
This structured approach turns your venue into a testing lab that produces insights sponsors cannot get from any other marketing channel.
Invest in Reusable Measurement Infrastructure
Sensor networks, dedicated Wi-Fi zones, and standardized data capture tools become more cost-effective when deployed across an entire season rather than built for a single event. Work with your production partner to design display systems and activation infrastructure that can be reconfigured for different sponsors while maintaining consistent measurement capability.

In Conclusion: Making Every Stadium Activation Measurable and Accountable
Measuring brand engagement in stadium activations requires planning that starts long before game day. Define your success metrics, establish baselines, integrate data capture into the activation design, and report results in business terms that sponsors understand.
The venues that build systematic measurement into every activation will attract and retain sponsors who value proof over promises. Those that continue relying on estimated impressions and attendance figures will lose ground to competitors who can show real engagement data.
When your next activation requires production support that includes fabrication, graphics, digital content, and installation under one roof, BluEdge brings over 125 years of production expertise and a 60,000 sq. ft. facility built for venue-scale projects. As a certified Woman Business Enterprise with six locations nationwide, BluEdge partners with sports teams and agencies to turn stadium spaces into measurable, fan-engaging experiences.
FAQs About Measuring Brand Engagement in Stadium Activations
What is the most important metric for stadium activation engagement?
Dwell time at the activation footprint is one of the most revealing indicators of genuine engagement. It measures how long fans voluntarily spent interacting with the experience, which correlates directly with brand recall and purchase intent after the event.
How do you measure engagement without disrupting the fan experience?
Passive measurement tools like Wi-Fi and Bluetooth sensors capture foot traffic and dwell time without requiring any action from fans. For active data capture, integrate sign-ups and QR scans into the participation flow so data collection feels like part of the experience.
How does BluEdge help venues measure activation performance?
BluEdge designs and builds stadium activations with measurement in mind from the start. By managing custom fabrication, digital content creation, and installation from a single production facility, BluEdge ensures that analytics-ready components are engineered into the physical structure of every activation.
What technology do you need to track engagement at a large sports venue?
A reliable measurement setup includes Wi-Fi or Bluetooth sensors for passive foot traffic data, interactive technology with built-in analytics for participation tracking, QR or NFC tools for first-party data capture, and social listening tools for hashtag and user-generated content monitoring.
How many game days of data do you need for meaningful measurement?
A single event provides a snapshot, but four to eight game days during a season produce the trend data needed for reliable optimization. BluEdge supports multi-event activation programs with scalable production that maintains consistent quality across repeated venue deployments.
What should a post-activation report include for sponsors?
A strong post-activation report covers three layers: physical presence data like foot traffic and unique visitors, active participation data including dwell time and interaction rates, and post-event follow-through data such as email opt-ins, offer redemptions, and social amplification metrics.